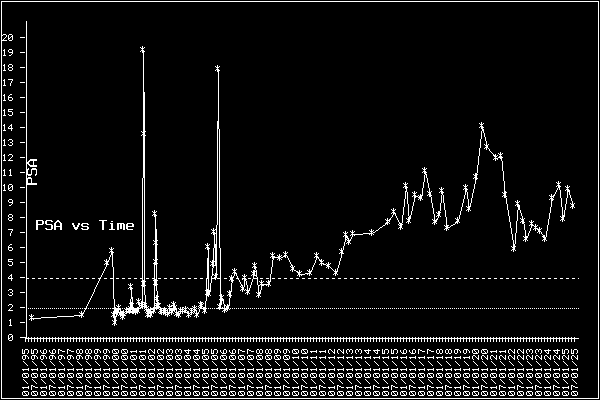
| Date | 02/25/95 | 12/15/97 | 04/27/99 | 07/27/99 | 08/01/99 | 09/21/99 | 10/12/99 | 10/27/99 | 11/29/99 | 01/04/00 | 02/07/00 |
|---|---|---|---|---|---|---|---|---|---|---|---|
| PSA | 1.72 | 1.9 | 5.4 | diagnosis | 6.2 (est) | 1.9 | 1.4* | 2.2 | 2.1 | 2.4 | 2.0 |
| Date | 03/16/00 | 04/17/00 | 06/02/00 | 07/10/00 | 08/10/00 | 09/08/00 | 09/21/00 | 10/05/00 | 11/10/00 | 12/11/00 | 01/11/01 |
| PSA | 1.8 | 2.0 | 2.2 | 2.3 | 2.2 | 3.8* | 2.5 | 2.2 | 2.2 | 2.1 | 2.2 |
| Date | 02/15/01 | 03/01/01 | 04/05/01 | 05/09/01 | 05/11/01 | 05/25/01 | 06/06/01 | 07/11/01 | 08/14/01 | 09/10/01 | 10/09/01 |
| PSA | 2.8 | 2.5 | 2.6 | 19.6 | 14.0 | 4.0 | 2.5 | 2.3 | 1.91 | 2.12 | 1.93 |
| Date | 11/08/01 | 12/11/01 | 01/09/02 | 01/11/02 | 01/15/02 | 01/21/02 | 01/29/02 | 02/05/02 | 02/13/02 | 02/22/02 | 03/28/02 |
| PSA | 2.15 | 2.15 | 8.64 | 6.70 | 5.43 | 5.45 | 4.01 | 2.97 | 2.43 | 2.51 | 2.49 |
| Date | 04/29/02 | 05/28/02 | 06/24/02 | 07/22/02 | 08/20/02 | 09/26/02 | 11/04/02 | 12/10/02 | 01/27/03 | 02/05/03 | 03/11/03 |
| PSA | 2.15 | 2.08 | 2.07 | 2.16 | 2.08 | 1.96 | 2.37 | 2.08 | 2.59 | 2.40 | 1.95 |
| Date | 04/22/03 | 06/16/03 | 08/01/03 | 09/22/03 | 11/17/03 | 01/13/04 | 03/19/04 | 05/06/04 | 07/14/04 | 08/04/04 | 10/15/04 |
| PSA | 1.89 | 2.18 | 2.15 | 2.25 | 1.88 | 2.08 | 2.29 | 1.91 | 2.54 | 2.53 | 2.17 |
| Date | 12/03/04 | 12/13/04 | 12/22/04 | 03/28/05 | 04/05/05 | 06/01/05 | 07/06/05 | 08/09/05 | 09/21/05 | 11/21/05 | 01/18/06 |
| PSA | 6.45 | 3.37 | 3.29 | 5.3 | 7.43 | 4.42 | 18.3 | 2.44 | 3.03 | 2.23 | 2.37 |
| Free PSA | 15 % | ||||||||||
| Date | 03/06/06 | 04/18/06 | 08/14/06 | 01/22/07 | 03/05/07 | 05/07/07 | 08/22/07 | 09/28/07 | 12/18/07 | 02/14/08 | 07/07/08 |
| PSA | 3.27 | 4.33 | 4.78 | 3.61 | 4.34 UCSF |
3.46 | 4.62 | 5.14 | 3.25 | 4.00 | 4.00 |
| Free PSA | 16 % | ||||||||||
| Date | 09/22/08 | 02/13/09 | 06/18/09 | 11/04/09 | 03/19/10 | 10/11/10 | 02/22/11 | 06/10/11 | 11/02/11 | 03/14/12 | 07/27/12 |
| PSA | 5.86 | 5.72 | 5.92 | 5.00 | 4.61 | 4.7 | 5.84 | 5.4 | 5.2 | 4.7 | 6.1 |
| Free PSA | |||||||||||
| Date | 10/11/12 | 12/17/12 | 03/04/13 | 03/25/14 | 02/17/15 | 06/17/15 | 10/29/15 | 02/04/16 | 04/14/16 | 08/18/16 | 12/13/16 |
| PSA | 7.22 Hunter Labs |
6.8 | 7.3 | 7.40 Hunter Labs |
8.1 | 8.8 | 7.8 | 10.5 | 8.2 | 9.9 | 9.7 |
| Free PSA | 21 % | 17 % | 15.9 % | ||||||||
| Date | 03/02/17 | 05/31/17 | 09/11/17 | 12/07/17 | 02/13/18 | 05/16/18 | 11/09/18 | 04/17/19 | 06/03/19 | 10/31/19 | 02/24/20 |
| PSA | 11.5 | 10.0 | 8.1 | 8.6 | 10.2 | 7.68 PAMF |
8.2 | 10.4 | 9.0 | 11.1 | 14.5 |
| Free PSA | 20 % | 19 % | |||||||||
| Date | 06/10/20 | 12/03/20 | 03/15/21 | 06/04/21 | 12/09/21 | 03/09/22 | 06/02/22 | 08/02/22 | 11/30/22 | 03/07/23 | 05/16/23 |
| PSA | 13.1 | 12.4 | 12.5 | 9.9 | 6.3 | 9.3 | 8.2 | 7.0 | 8.0 | 7.7 | 7.5 |
| Free PSA | |||||||||||
| Date | 09/05/23 | 01/17/24 | 06/05/24 | 09/05/24 | 12/10/24 | 03/11/25 | 09/03/25 | ||||
| PSA | 7.0 | 9.7 | 10.6 | 8.3 | 10.3 | 9.2 | 9.4 | ||||
| Free PSA |

Prev
Next                                                                                                                 3/11
Text